

NSI Market Intelligence | October 25, 2026
By Gabriel Nicolaev – CyGuru Financial markets are frequently described through numbers, but not every number carries the same significance for the people making decisions. A price of $3,997.40 and a price of $4,000 may differ by less than one-tenth of one percent, yet the second can attract disproportionate attention. It is easier to remember, easier to communicate, more visible in financial headlines and more likely to become a reference point around which traders organize expectations. This phenomenon becomes especially important when a major asset approaches a round-number threshold after a prolonged period of directional movement. Gold's decline below $4,000 during the final full trading week of October 2026 provides a relevant case for investigating this relationship.
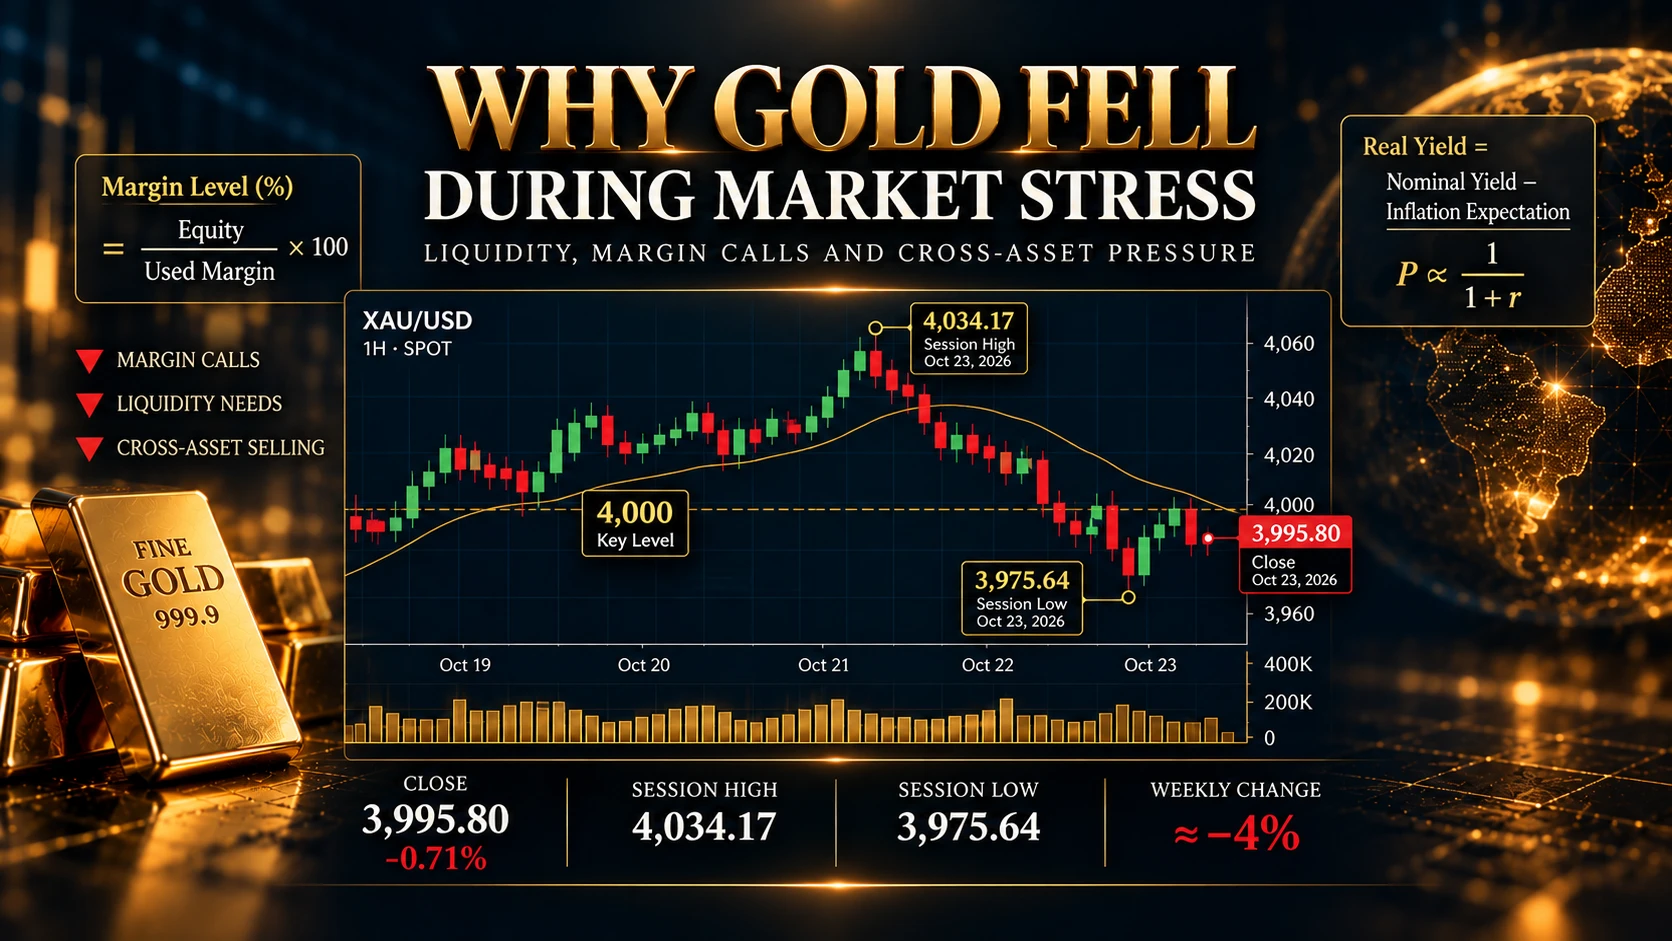
On Friday, October 23, XAU/USD recorded an indicative closing price of $3,995.80, following a session high of $4,034.17 and a low of $3,975.64, according to Investing.com's historical series. Reuters separately reported that spot gold had slipped below $4,000 for the first time since mid-July and was heading toward a weekly decline of approximately 4%. These observations establish that gold crossed a highly visible numerical threshold during a period of substantial selling pressure. They do not establish that all market participants regarded $4,000 as a decisive technical level, that a particular quantity of stop-loss orders was concentrated there or that the price movement was caused by collective fear. Those are separate hypotheses requiring additional evidence. Within the proposed NSI Market framework, the $4,000 episode illustrates a central principle: a market price can become psychologically important without providing a direct measurement of market psychology. Understanding this distinction requires examining price clustering, order placement, market liquidity, technical expectations and the limitations of behavioral interpretation.
Why Round Numbers Attract Financial Attention
Human beings frequently organize complex information around simplified reference points. Round numbers are easy to recognize and remember. They are also convenient for communication and comparison. A financial analyst may describe gold as approaching $4,000 rather than focusing on every intermediate quotation. A trader may use the same number when discussing possible support or resistance. A financial news headline may emphasize whether the threshold has been crossed. As a result, a round number can become prominent even when its mathematical significance is limited. The distinction between mathematical and psychological significance is important. There is no fundamental physical property that makes $4,000 intrinsically different from $3,999.90. Nevertheless, market participants may treat these prices differently because their expectations, trading rules and order-placement practices are not distributed uniformly across every possible quotation. This creates the possibility that price behavior near round numbers may differ from behavior at less prominent levels. Whether such differences occur in a particular market must be established through data.
Price Clustering and the Structure of Financial Orders
Price clustering refers to the tendency for certain price values to occur or attract trading activity more frequently than would be expected under a uniform distribution. Researchers have investigated clustering in quoted prices, transaction prices and order-placement behavior. One important contribution comes from Carol Osler's research into foreign-exchange markets. In her 2003 paper, Currency Orders and Exchange Rate Dynamics: An Explanation for the Predictive Success of Technical Analysis, Osler examined the distribution of stop-loss and take-profit orders. The study documented that take-profit orders tended to cluster particularly strongly at round numbers, while stop-loss orders were often concentrated just beyond such levels. This distinction has important implications. Take-profit orders may create conditions in which existing trends encounter opposing transactions.
Stop-loss orders, by contrast, may contribute to further directional movement once triggered. These findings provide a plausible microstructural explanation for why some support and resistance levels appear to generate reversals, while breaks beyond them can sometimes be followed by acceleration. However, the original evidence concerned particular foreign-exchange order data. It should not be presented as direct evidence that gold orders were distributed in exactly the same way around $4,000 in October 2026. The broader mechanism is relevant to formulating research hypotheses about XAU/USD, but its application to the specific episode requires appropriate gold-market data.
Why Stop-Loss Orders Can Accelerate a Price Movement
A stop-loss order may become executable when a specified market condition is reached. Depending on the instrument, broker and order type, activation can produce an instruction to trade at the market or according to another execution mechanism. When many orders are activated within a narrow price region, the resulting transactions can contribute to directional pressure. Consider a hypothetical situation in which numerous traders hold long gold positions with protective orders below a visible support level. If the price falls through that level, some orders may become active. Their execution could add selling pressure to an already declining market. That additional selling may influence subsequent prices, potentially activating other orders. This creates the possibility of a price cascade.
Osler's 2002 Federal Reserve Bank of New York research examined evidence that stop-loss orders can contribute to rapid, self-reinforcing exchange-rate movements. The important point is that an order-triggering mechanism can affect market prices without requiring every participant to experience the same emotion. A stop-loss may be executed automatically. The trader may not even be watching the market when the order becomes active. Therefore, a rapid movement through a price level cannot automatically be interpreted as collective panic. It may involve systematic execution, liquidity conditions and pre-existing orders.
Why Take-Profit Orders Can Produce a Different Effect
Take-profit orders can operate differently from stop-loss orders in certain market contexts. Imagine a rising market approaching a round-number resistance area. Some traders holding profitable long positions may have established instructions to sell near that level. If those transactions provide sufficient opposing flow, the market may temporarily stop advancing or reverse. However, a reversal is not guaranteed. New buying demand may exceed the available selling interest. Liquidity may be sufficient to absorb the transactions without substantial price disruption. The price may also accelerate through the level if the balance of executable orders favors continuation. This is why a round number should not be treated as an automatic reversal point. Its significance depends on the actual distribution of orders, the arrival of new information and the available liquidity.
The October 23 XAU/USD Case: What Was Observed?
The October 23 session provides a concrete historical reference. According to the Investing.com XAU/USD historical series, the session opened at approximately $4,025.38, reached $4,034.17, declined to $3,975.64 and closed near $3,995.80. The difference between the session high and low was approximately $58.53 per troy ounce. That range illustrates substantial intraday movement around the $4,000 reference. The closing price was approximately $4.20 below the threshold. Reuters reported that the broader decline occurred amid rising oil prices, inflation concerns and expectations concerning future Federal Reserve policy. The same report discussed the possibility that margin-related selling associated with equity-market weakness contributed to pressure on precious metals. These observations provide context. However, the available daily OHLC values do not reveal the complete intraday sequence, the distribution of limit orders or the volume of stop-loss orders activated at specific prices. They also cannot establish how many traders consciously treated $4,000 as psychologically important. A precise analysis of the crossing would require time-stamped intraday prices and appropriate market microstructure data.
Support and Resistance Are Conditional, Not Permanent
Support and resistance are often presented as fixed price boundaries. In reality, their significance depends on the interaction of market participants, available liquidity and changing information. A level that previously attracted buying may later become an area of selling. A price that generated a reversal during one session may be crossed without resistance during another. The existence of a historical reaction does not create an obligation for the market to repeat it. This is especially important when analyzing XAU/USD around major macroeconomic events. An inflation release, a Federal Reserve decision or an unexpected geopolitical development may change the perceived value of gold sufficiently to overwhelm previously relevant technical references. Therefore, the $4,000 threshold should be treated as a price area to investigate, not as a permanent law of market behavior.
What Does Acceptance Below $4,000 Actually Mean?
Market commentary frequently uses the term acceptance to describe a situation in which price remains on one side of an important level. However, acceptance is not a universally standardized scientific variable. Different trading methodologies define it differently. One strategy may require a daily close below the level. Another may require multiple completed candles, sufficient trading activity or a failed attempt to recover the previous price area. A third may use volume-at-price or auction-market concepts. For NSI Market research, the definition must be explicit. A scientifically useful model cannot simply classify a movement as accepted because the analyst considers the chart visually convincing. The observation must be reproducible. For example, a research protocol might define a sustained break as a specified number of completed observations below a threshold, combined with independently defined volatility or volume conditions. The parameters would need justification and evaluation on historical data. Without such definitions, the interpretation remains subjective.
False Breakouts and the Psychology of Confirmation
A false breakout occurs when price crosses a level but subsequently fails to sustain movement beyond it, according to the criteria of a particular trading methodology. False breakouts are important because they can create uncertainty about whether the original price movement represented a durable change in market conditions. Consider a hypothetical recovery above $4,000 following Friday's decline. Some traders might interpret the move as evidence that selling pressure is weakening. Others might wait for additional confirmation. If price subsequently falls back below the level, traders who entered prematurely may face unfavorable outcomes. However, the failure of a breakout does not establish that those traders were motivated by FOMO. Their actions may have been consistent with a strategy designed for early entries. The behavioral classification requires knowledge of the intended trading procedure. This distinction becomes particularly relevant to the proposed NSI framework. Observable market patterns and individual decision quality are related research subjects, but they cannot be treated as identical.
Round Numbers and Anticipated Reward
A major price threshold can influence expectations concerning potential financial reward. A trader observing gold approach $4,000 from below may anticipate a breakout and calculate possible gains from a continued rally. Another observing the same level from above may anticipate a breakdown and consider short exposure. The round number becomes a common reference, but the expectations attached to it differ. The market does not contain one uniform motivational state. Different participants may be positioned in opposite directions and pursuing different objectives. This is why a global Reward Activation score derived exclusively from the proximity of price to $4,000 would be scientifically misleading. A market-context indicator could measure price extension, momentum and the frequency of breakout attempts. It could not independently measure the dopamine activity, greed or anticipated reward of market participants.
Why the Same Price Can Represent Different Risks
A price level has no universal behavioral meaning independent of the trader's position and strategy. For a participant holding a profitable long position, a decline toward $4,000 may represent the possibility of surrendering unrealized gains. For a trader holding a short position, the same movement may be favorable. For someone waiting to buy, the level may represent a potential entry area. For a participant with no exposure, it may have little immediate financial significance. The objective market price is identical. The subjective consequences differ. This illustrates the difference between NSI Market and NSI Personal. NSI Market examines observable external conditions. NSI Personal concerns proposed research dimensions relevant to the individual. NSI Interaction investigates whether specific market conditions are associated with measurable deviations from a particular trader's documented strategy. These three levels should remain analytically separate.
The Role of Liquidity Around Major Price Levels
Liquidity concerns the ability to execute transactions with limited price impact and reasonable transaction costs. A market can appear highly active while still experiencing temporary liquidity shortages. The quantity of available orders, their location and the speed at which new liquidity arrives can influence price behavior. Around an important reference level, order concentrations may create temporary areas of substantial transaction activity. But visible trading volume does not necessarily reveal the intentions of participants. Likewise, a sharp price movement does not establish that liquidity was absent. A comprehensive analysis would require suitable bid-ask spread data, market depth or other relevant measures. For spot gold, the decentralized structure of trading creates additional challenges. No single retail XAU/USD chart necessarily represents every transaction across the global gold market. Consequently, NSI Market should avoid treating broker-specific volume as an exact measurement of global gold-market participation.
Why the $4,000 Level Cannot Predict the Next Direction
A psychological price threshold may influence attention and order placement. That does not mean it reliably predicts future price direction. A market may reverse at a round number, accelerate through it or fluctuate around it without establishing a sustained trend. The result depends on the balance of orders and changing information. The same level may behave differently during high-liquidity and low-liquidity sessions. It may also react differently before and after major economic announcements. The appropriate research objective is therefore to investigate the conditions under which specific outcomes occur, rather than assuming that the level itself contains predictive certainty. A historical relationship must be tested using information available before the outcome, with appropriate out-of-sample evaluation. Otherwise, apparent patterns may simply reflect retrospective selection.
Three Conditional Scenarios for the Next Trading Session
Following the October 23 close below $4,000, several conditional scenarios are relevant. The first involves recovery above the round-number threshold. Such a movement would indicate that price had returned above the previous reference. Whether it represents a durable reversal would depend on subsequent market behavior, liquidity and new information. The second involves repeated failure to maintain prices above $4,000. That pattern could be consistent with continuing selling pressure around the reference area. However, it would not independently establish the future direction of gold. The third involves renewed weakness toward or below the previous session low. Such a movement would indicate further downside extension relative to the latest observed range. None of these scenarios is a trading instruction. They are alternative outcomes that can be evaluated as new observations become available. A serious NSI Market report should describe what would confirm or invalidate each interpretation rather than assigning unsupported probabilities.
How NSI Market Could Study Round-Number Effects
A future research program could examine whether XAU/USD behaves differently near major round-number levels compared with suitably matched control prices. The first step would involve defining the levels and observation windows before examining the outcomes. Researchers could then investigate realized volatility, reversal frequency, directional continuation and changes in available liquidity. The analysis should control for market regime, time of day and economic announcements. It should also account for the possibility that round numbers appear important simply because analysts select memorable examples after the fact. Appropriate statistical testing would be necessary to determine whether any observed effect exceeds what would be expected under reasonable comparison conditions. If a model were developed, its performance would need evaluation on data not used to select the original parameters. The existence of published evidence concerning foreign-exchange order clustering supports the research question. It does not eliminate the need for independent testing in XAU/USD.
Why Artificial Intelligence Must Not Invent Market Psychology
AI systems can identify numerical patterns, compare historical periods and summarize financial information. They can also produce convincing explanations that exceed the evidence available. An algorithm might observe repeated failures around $4,000 and label the market as fearful. But without direct evidence concerning participant experience, the label would be speculative. A more responsible system would describe the actual observations. For example, it could report repeated price rejection near a defined threshold, elevated realized volatility or increased frequency of directional reversals. If a behavioral interpretation is proposed, it should be identified as a hypothesis. The distinction between data and inference is central to the scientific credibility of NSI Market.
The Difference Between a Market Level and a Psychological Diagnosis
The $4,000 level can be observed directly. Price crossings can be recorded. Returns and volatility can be calculated. With suitable data, liquidity and order placement can also be investigated. However, fear, greed, regret and cognitive control are not directly visible in the price chart. These constructs concern human functioning and require appropriate measurement. A model that classifies all selling below a round number as panic would confuse a financial outcome with an unverified emotional explanation. Similarly, describing every breakout as FOMO would ignore the possibility of legitimate systematic execution. The purpose of NSI Market should be to make market conditions more interpretable without claiming to possess information it has not measured.
Conclusion: A Round Number Can Organize Expectations Without Controlling the Market
Gold's movement below $4,000 during October 2026 demonstrates how a recognizable numerical threshold can become central to market commentary and technical interpretation. Round numbers can influence attention, communication and potentially the distribution of financial orders. Research into foreign-exchange markets provides evidence that stop-loss and take-profit orders may cluster around such levels, helping explain why certain price regions can be associated with reversals or accelerated movements. However, the existence of these mechanisms does not establish that the same order distribution occurred in gold during the October 23 session. The available price data demonstrate that XAU/USD crossed the threshold. They do not reveal the complete intentions, emotions or positioning of market participants.
For NSI Market, this distinction is essential. The purpose of analyzing psychologically prominent levels is not to transform price movements into unsupported diagnoses of collective fear or greed. It is to investigate whether observable market conditions differ around important reference points and whether those differences provide reliable information. The $4,000 threshold may remain relevant as traders evaluate subsequent market developments. But its importance must be reassessed as new information arrives. A round number can attract attention. It can become a reference for orders and expectations. It can influence how market events are discussed. It cannot guarantee a reversal, continuation or profitable transaction. The market does not obey round numbers because they are psychologically impressive. Their influence, when it exists, emerges through actual decisions, orders, liquidity and the continuous interaction of buyers and sellers. That is the distinction between an attractive market narrative and a scientifically defensible analysis.
Gabriel Nicolaev – CyGuru
Frequently Asked Questions
Why is $4,000 an important psychological level for gold?
The $4,000 level is a prominent round-number reference that market participants may use when discussing price expectations, evaluating positions and planning transactions. Its significance depends on actual trading activity, liquidity, positioning and market conditions. The round number itself does not guarantee support or resistance.
Do institutional traders place orders at round numbers?
Research in foreign exchange markets has documented clustering of certain order types around round-number exchange rates. However, those findings do not establish the precise distribution of institutional orders around $4,000 in XAU/USD. Confirming such concentration requires relevant order-book or transaction data.
Why does gold sometimes reverse near a psychological level?
A reversal may reflect changing order flow, liquidity, profit-taking, new information or the failure of directional demand to continue. Psychological reference points may contribute to market behavior, but a reversal cannot automatically be attributed to collective fear or profit-taking without supporting evidence.
What happens when XAU/USD breaks below $4,000?
A break below $4,000 establishes that the market traded beneath the reference level. Its significance depends on whether prices remain below it, recover quickly or repeatedly test it. A temporary break is different from sustained acceptance below the level.
What is a false breakout in gold trading?
A false breakout occurs when price moves beyond a defined technical level but subsequently returns within the previous trading structure. The definition must specify the reference level, observation period and criteria for confirming the return. A false breakout is not necessarily evidence of deliberate market manipulation.
Can stop-loss orders accelerate a gold-price movement?
Stop-loss orders may contribute to directional acceleration when triggered and executed, particularly if available liquidity is limited. However, the extent of their influence depends on market structure, order types and actual liquidity conditions. Their presence cannot be established from price charts alone.
Is $4,000 guaranteed to become support after gold moves above it?
No. A former resistance level does not automatically become support. Such interpretations are technical hypotheses that require observation and validation. Price may cross the same level repeatedly without establishing a stable directional regime.
Can round-number levels attract algorithmic trading?
Algorithmic strategies may incorporate round numbers, technical reference levels, liquidity conditions and other inputs. However, it is not possible to determine the behavior of all automated systems from a price chart.
Does a break below $4,000 prove that traders are afraid?
No. A price decline does not directly measure the psychological state of market participants. Selling can reflect portfolio adjustments, systematic execution, hedging, liquidity needs or changing financial expectations.
Can NSI Market identify global FOMO or panic around $4,000?
NSI Market may investigate observable conditions such as price acceleration, volatility expansion, repeated breakouts and liquidity changes. These observations cannot independently establish global FOMO, panic or other collective psychological states.
Is the $4,000 level useful for predicting future XAU/USD prices?
A reference level may be useful for organizing conditional scenarios and evaluating market structure. However, its predictive usefulness must be demonstrated through historical and out-of-sample testing. No particular price level guarantees future direction.
What should traders examine when gold approaches $4,000?
Relevant observations include price acceptance or rejection, volatility, spreads, liquidity, macroeconomic announcements and the behavior of related financial markets. Any trading decision must also consider the individual's strategy and risk constraints.
Conclusion: A Round Number Is a Reference Point, Not a Market Law
The significance of $4,000 in gold trading extends beyond its numerical appearance. Round numbers can become widely recognized reference points, influencing how market participants discuss price expectations, evaluate financial outcomes and organize certain trading decisions. Research on foreign exchange markets provides evidence that particular order types can cluster around prominent price levels. These findings offer a useful foundation for studying market microstructure and the possible effects of order concentration. However, evidence from one market cannot be transferred automatically to another. The distribution of orders around $4,000 in XAU/USD must be established through relevant market data rather than assumed from the psychological attractiveness of the number. A break above or below the level is an observable event. Whether that movement becomes a sustained trend, a temporary liquidity excursion or a failed breakout depends on subsequent market activity.
The October 23, 2026 session provides a relevant example. Gold traded on both sides of $4,000 before closing slightly below it, according to the cited historical price series. That observation establishes the level's relevance during the session, but it does not prove that institutional orders were concentrated at the exact price or that a particular psychological mechanism caused the decline. Within the proposed NSI Market framework, round-number analysis can contribute to the investigation of price structure, volatility and observable trading conditions. It cannot independently identify fear, greed, revenge trading or the emotional state of market participants. A scientifically responsible model must distinguish market evidence from behavioral interpretation. I believe the greatest analytical mistake is to treat a widely recognized price as though it possesses an intrinsic power over future market direction.
A round number can attract attention. It can become a reference for orders. It can coincide with significant changes in liquidity or price behavior. But it does not control the market. Its significance must be demonstrated through what participants actually do, not through what analysts assume they must be thinking. The market does not reverse because a number is psychologically impressive. It changes direction when the interaction of orders, liquidity and information produces a different balance of transactions. The value of $4,000 lies in its usefulness as a reference for examining that process, not in any guarantee that it will determine the next movement of gold.
Gabriel Nicolaev – CyGuru
Selected Scientific Bibliography
-
Osler, C. L. (2003). Currency orders and exchange-rate dynamics: Explaining the success of technical analysis. The Journal of Finance, 58(5), 1791–1820. https://doi.org/10.1111/1540-6261.00588
-
Osler, C. L. (2005). Stop-loss orders and price cascades in currency markets. Journal of International Money and Finance, 24(2), 219–241.
-
Harris, L. (1991). Stock price clustering and discreteness. The Review of Financial Studies, 4(3), 389–415. https://doi.org/10.1093/rfs/4.3.389
-
Kandel, S., Sarig, O., & Wohl, A. (2001). Do investors prefer round stock prices? Evidence from Israeli IPO auctions. Journal of Banking & Finance, 25(8), 1543–1551.
-
Biais, B., Hillion, P., & Spatt, C. (1995). An empirical analysis of the limit order book and the order flow in the Paris Bourse. The Journal of Finance, 50(5), 1655–1689.
-
Cont, R., Stoikov, S., & Talreja, R. (2010). A stochastic model for order book dynamics. Operations Research, 58(3), 549–563. https://doi.org/10.1287/opre.1090.0780
-
Kahneman, D., & Tversky, A. (1979). Prospect theory: An analysis of decision under risk. Econometrica, 47(2), 263–291.
-
Shmueli, G. (2010). To explain or to predict? Statistical Science, 25(3), 289–310. https://doi.org/10.1214/10-STS330
-
Investing.com. XAU/USD Historical Data. Historical session reference: October 23, 2026. https://www.investing.com/currencies/xau-usd-historical-data
Research limitation: Studies of order clustering in foreign exchange and equity markets provide theoretical and empirical context, but they do not directly establish order concentration around the October 2026 XAU/USD $4,000 level.
About the Author
Gabriel Nicolaev – CyGuru is an author and entrepreneur whose work explores gold trading, market structure, behavioral finance, neuroscience-oriented research, artificial intelligence and human decision-making.
He is the author of The Gold Nervous System Indicator, a 36-chapter interdisciplinary work introducing the proposed five-dimensional NSI framework.
Through NSI.GOLD, he develops research-oriented publications examining the relationship among financial-market conditions, human decision-making and the scientific limits of behavioral interpretation.
 Market
 Market
 Market