
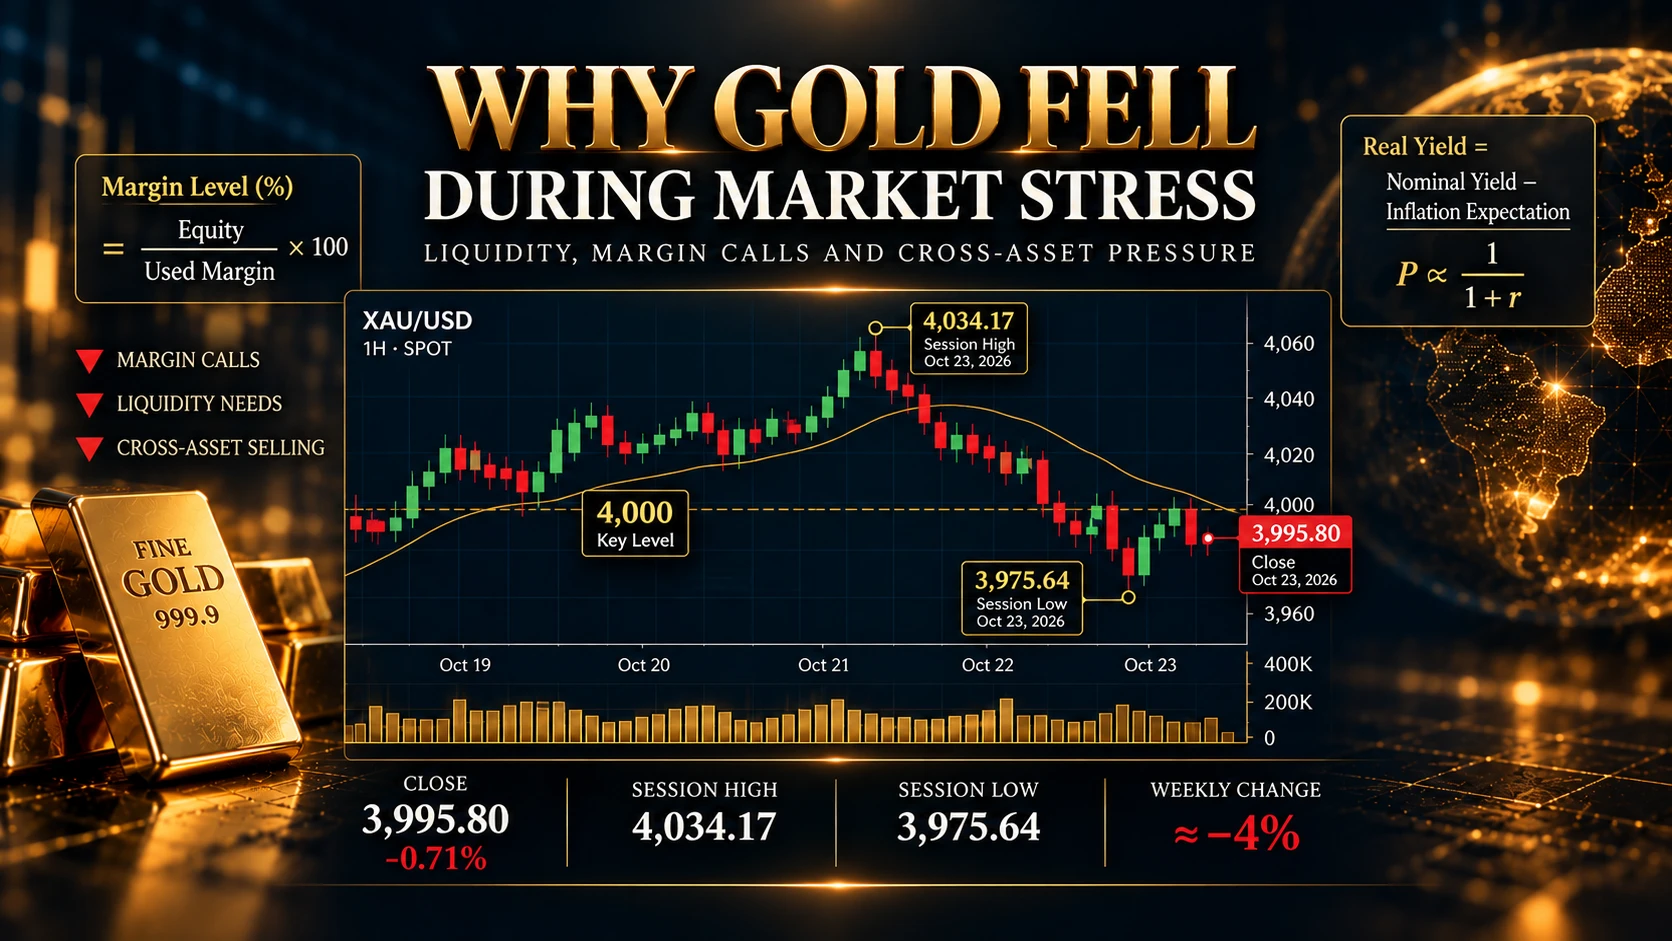
NSI Market Intelligence | October 25, 2026 Gold is widely regarded as a defensive asset, a store of value and a potential source of protection during periods of financial and geopolitical uncertainty. Yet one of the most revealing characteristics of the gold market is that the metal can decline sharply precisely when global conditions appear most threatening. Equity markets weaken, geopolitical risks intensify, inflation expectations become unstable and investors confront increasing uncertainty. Under such circumstances, conventional financial narratives suggest that gold should appreciate as capital moves toward safety. Sometimes it does. At other times, gold is sold alongside equities, commodities and other assets. This apparent contradiction is not evidence that gold has lost its economic significance. It reveals that financial markets operate through several mechanisms simultaneously. The demand for protection is only one component of price formation. Investors must also manage liquidity, leverage, collateral requirements, interest-rate exposure and the immediate consequences of losses elsewhere in their portfolios.
During periods of acute financial pressure, the need to obtain cash can become more urgent than the desire to retain a defensive investment. The trading week ending October 23, 2026, provides a contemporary example of these competing forces. Gold experienced substantial selling pressure while elevated energy prices increased inflation concerns and reinforced expectations that U.S. monetary policy could remain restrictive. The metal moved below the psychologically important $4,000 level and approached a three-month low. Reuters reported that spot gold fell to approximately $3,975.23 per troy ounce during Friday's session, while the weekly decline reached approximately 4% at the time of its report. Gold futures also declined. These figures represent observations at specified times, not a universal closing price across every trading venue.
The more important analytical question is why gold could weaken during an environment characterized by substantial geopolitical and financial uncertainty. Within the proposed NSI Market framework, the answer begins with a distinction between perceived danger, observable market pressure and the mechanisms through which financial participants are forced or incentivized to act. A market can experience substantial selling without demonstrating that every participant is frightened. Equally, a decline in gold does not establish that investors have collectively abandoned its long-term defensive role. The immediate price movement must be examined through the interaction of monetary expectations, liquidity constraints, portfolio adjustments and market structure.
The Safe-Haven Paradox: Why Defensive Assets Can Fall
The expression safe haven is frequently misunderstood as a promise that an asset will appreciate whenever uncertainty increases. In reality, defensive characteristics are conditional. Gold has historically displayed useful diversification properties under various market conditions, but its behavior is influenced by the nature of the shock, the financial constraints facing investors and the time horizon being examined. A geopolitical event may increase demand for gold because investors seek protection against uncertainty. At the same time, the same event may increase energy prices, intensify inflation concerns and influence expectations for monetary policy. If investors anticipate higher interest rates or rising real yields, the relative attractiveness of non-yielding gold can decline. Meanwhile, losses in equity or derivatives portfolios may create immediate demands for cash.
An investor who would prefer to retain gold may nevertheless sell part of the position to meet obligations elsewhere. These mechanisms can operate simultaneously. The result is a market in which the long-term desire for protection coexists with short-term selling pressure. This is not necessarily irrational behavior. It may represent a rational response to binding financial constraints. The World Gold Council has documented previous episodes in which gold experienced selling pressure because investors needed liquidity during broader market stress. Its March 2026 commentary similarly emphasized deleveraging and liquidity demands as important contributors to that period's decline. The implication is that gold's defensive role cannot be evaluated solely by examining its direction during one difficult session.
Liquidity: The Mechanism Behind Forced Selling
Liquidity has several meanings in financial markets. Market liquidity concerns the ability to execute transactions without producing excessive price disruption. Funding liquidity concerns the ability of financial participants to obtain the cash or financing needed to meet obligations. These two forms of liquidity are related but not identical. A participant may own assets that are valuable over the long term while facing an immediate shortage of available cash. If the participant must satisfy a margin call, repay financing or meet investor redemptions, some assets may need to be sold. Gold can become a source of liquidity because it is traded internationally and supported by deep markets, although liquidity differs across instruments and trading conditions.
The investor may sell gold not because the long-term investment thesis has changed but because the position can be converted into cash. This distinction explains an important feature of financial crises: the assets sold most aggressively are not always those considered least desirable. Sometimes investors sell what they can sell rather than what they would prefer to sell. The resulting transactions can place downward pressure on prices even when the underlying demand for defensive protection remains meaningful.
Margin Calls and the Mathematics of Financial Pressure
Leverage allows a trader or investor to control financial exposure greater than the capital initially committed. This increases sensitivity to price movements. When the market moves adversely, account equity can decline relative to the exposure being maintained. Depending on the instrument, broker, clearing arrangement and contractual requirements, additional collateral may become necessary. A simplified margin-level calculation used in some leveraged trading environments is: Margin Level (%) = (Account Equity / Used Margin) × 100 For example, consider a hypothetical account with equity of $20,000 and used margin of $10,000. The margin level is 200%. If adverse market movements reduce equity to $12,000 while used margin remains unchanged, the margin level becomes 120%.
This example is purely illustrative. It does not describe actual gold-market positions from October 23, 2026. The specific consequences depend on the broker's rules and the relevant financial instrument. There is no universal margin-call threshold applicable to every market participant. When collateral requirements are breached, the participant may need to deposit additional funds, reduce positions or accept liquidation. This can create selling pressure unrelated to the investor's long-term expectations. A participant may remain optimistic about gold but still need to sell it to satisfy immediate financial requirements. That is the essential difference between investment conviction and funding capacity.
Why Losses in Technology Stocks Can Affect Gold
Cross-asset pressure occurs when developments in one financial market influence positions in another. Consider an investment fund holding technology equities, gold and several derivatives positions. A sharp decline in the equity portfolio may reduce available capital or increase collateral demands. If the fund must raise cash quickly, it may sell gold even though the metal was originally purchased for diversification. The transaction is not necessarily a bearish assessment of gold. It may be a consequence of portfolio-level financial constraints. During the October 23 market decline, Reuters identified forced selling associated with losses in technology stocks and related margin pressure as one contributor to gold's weakness. This mechanism is important because it shows why analyzing XAU/USD in isolation can produce incomplete explanations. The gold market is connected to the broader financial system through capital allocation, collateral, leverage and liquidity management. A sharp movement in equities can affect gold even without a direct change in physical gold demand.
The Relationship Between Oil Prices, Inflation and Gold
The October 2026 episode also involved substantial pressure from energy markets. Oil prices had risen sharply amid concerns about supply disruptions in the Middle East. Higher energy prices can influence inflation through transportation, production costs and household energy expenditure. However, the relationship between oil prices and monetary policy is not automatic. Central banks consider whether an energy shock is temporary, whether inflation expectations remain anchored and whether broader economic activity is weakening. An oil-price increase can raise headline inflation while simultaneously reducing real household purchasing power and economic growth. The effect on expected interest rates therefore depends on the broader macroeconomic context. During the October selloff, investors increasingly considered the possibility that inflation pressures could limit the Federal Reserve's ability to ease monetary policy. This created an additional source of pressure on gold. The metal provides no contractual interest payment. When interest-bearing alternatives become more attractive, holding gold may involve a higher opportunity cost. Yet this relationship must be evaluated through real yields and expectations, not simply nominal interest rates.
Real Interest Rates: The Mathematical Relationship
A simplified approximation for the real interest rate is: Real Interest Rate ≈ Nominal Interest Rate − Expected Inflation Rate For example, if a nominal yield is 5% and expected inflation is 3%, the approximate real yield is 2%. The more precise Fisher relationship is: Real Rate = [(1 + Nominal Rate) / (1 + Expected Inflation)] − 1 The values must be expressed as decimal rates in this formula. Real yields are relevant to gold because they influence the relative appeal of assets that do not generate contractual income. However, the relationship is not perfectly stable. Gold prices are also affected by investment demand, central-bank activity, currency movements, geopolitical conditions and other factors. A rise in real yields can create pressure on gold, but it does not guarantee a decline. Likewise, falling real yields do not guarantee appreciation. The analytical task is to examine the interaction among variables rather than convert one macroeconomic relationship into a deterministic trading rule.
Why a Stronger Dollar Can Reinforce Selling Pressure
Gold is commonly quoted internationally in U.S. dollars. Changes in the dollar can therefore affect its price and its cost to investors operating in other currencies. A stronger dollar can make dollar-denominated gold more expensive for some non-U.S. buyers, potentially influencing demand. However, the relationship is not perfectly inverse. Gold and the dollar can sometimes appreciate together, particularly when different forms of uncertainty influence global capital flows. For the October 2026 episode, dollar movements should be examined alongside yields, energy prices and liquidity conditions. A responsible NSI Market analysis should not assume that every decline in gold is caused by a stronger dollar without checking the relevant observations. The explanatory value of any variable depends on what actually happened during the period being studied.
The $4,000 Level: Market Structure Versus Psychological Interpretation
Gold's movement below $4,000 attracted attention because round numbers frequently become prominent reference points in financial markets. Traders may discuss them, place conditional orders near them or use them when evaluating market structure. Yet the importance of a round number is contextual. It does not possess a universal mathematical property that forces prices to reverse or continue. The appropriate analysis concerns what happens around the level. Does the market repeatedly reject attempts to recover above it? Does price remain below it during subsequent trading sessions? Does volatility increase near the level? Are movements supported by observable volume or liquidity changes where reliable data are available? These questions concern measurable market behavior. By contrast, claiming that the breakdown proves global panic would require psychological evidence that price data alone cannot provide. The proposed NSI Market system should preserve this distinction.
Why Falling Prices Do Not Prove Panic Selling
Financial commentary frequently uses the word panic to describe rapid declines. But a sharp price movement can result from several mechanisms. Systematic strategies may reduce exposure after volatility increases. Leveraged positions may be liquidated because of margin requirements. Institutional investors may rebalance portfolios. New economic information may change expected returns. These processes can produce substantial selling without requiring a universal psychological state. Some participants may experience fear. Others may act according to predetermined rules. Still others may interpret the same decline as a buying opportunity. The market price reflects executed transactions, not a direct measurement of collective emotion. Within NSI Market, a label such as Elevated Liquidity Pressure is therefore more defensible than an unsupported claim that the global market is frightened.
The Difference Between Market Pressure and Revenge Trading
Revenge trading concerns decisions made by individuals who may attempt to recover previous financial losses through subsequent transactions. A declining gold market cannot establish that such behavior is occurring globally. Even a rapid rebound after a sharp decline does not prove that traders are attempting to recover losses. The rebound could reflect short covering, renewed investment demand, changes in liquidity or updated information. To investigate revenge trading scientifically, researchers would need data linking previous losses with subsequent decisions by relevant participants. Market prices alone do not contain that complete information. This is why NSI Market and NSI Personal must remain conceptually distinct. NSI Market investigates observable financial conditions. NSI Personal concerns research into individual physiological, psychological and behavioral processes. NSI Interaction would examine whether reliable evidence supports relationships between those domains.
NSI Market: A Framework for Interpreting Financial Stress
The proposed NSI Market framework can organize observations across several analytical domains. Threat-related market conditions may involve rapid adverse price movements, volatility shocks and deteriorating liquidity. Reward-related market conditions may involve accelerating momentum and price extension. Decision-complexity conditions may involve repeated reversals, conflicting signals and unstable market structure. Social-information conditions may involve concentrated narratives, sentiment shifts or positioning changes, when suitable data exist. These are market-context proxies. They are not measurements of the five nervous-system dimensions in actual traders. Recovery Capacity, in particular, cannot be inferred from gold prices because it concerns individual functioning, including sleep and fatigue. A scientifically responsible system should therefore leave that dimension unavailable in market-only analysis. The objective is not to create five impressive-looking numerical scores. It is to determine whether the selected observations improve understanding of financial conditions and the decisions traders face.
How an Analytical NSI Market Chart Should Be Constructed
A useful analytical chart should contain observations that can be independently reproduced. For the October 19–23 period, the primary series would be timestamped XAU/USD prices from a specified data provider. The chart could include the $4,000 reference level, the observed session range and a documented volatility measure. A separate panel could show changes in a relevant Treasury yield or the U.S. Dollar Index. Another panel might compare gold with an equity benchmark during the same period. However, these comparisons require synchronized timestamps and consistent data frequencies. A five-minute gold chart should not be compared casually with a daily closing value for another asset. Likewise, volume from one futures venue should not be presented as the complete trading volume of the decentralized spot gold market. The meaning of each data series must be documented. For NSI.GOLD, analytical figures should function as evidence rather than decoration.
The October 23 Case: What Is Known and What Remains Uncertain
Several observations are supported by contemporaneous market reporting. Gold experienced a substantial weekly decline. Spot prices fell below $4,000. Higher oil prices increased concerns about inflation and restrictive monetary policy. Broader financial-market weakness and margin-related selling were also identified as contributors. These observations support a description of elevated market pressure. However, the exact contribution of each mechanism cannot be determined simply from the size of the gold decline. The available reporting does not establish what proportion of selling resulted from margin calls compared with changes in monetary expectations. Nor does it demonstrate the psychological motives of every participant. A serious analysis must resist the temptation to assign precise percentages to explanations that have not been measured.
Three Scenarios for the Next Trading Session
The first scenario is stabilization. Gold may recover above the $4,000 reference level and maintain that recovery during subsequent trading. Such behavior would suggest that the breakdown had not yet resulted in durable acceptance below the level. The second scenario is renewed selling pressure. Attempts to recover may fail, and prices may revisit or move below the recent session low. This would indicate continuation of weakness, but not necessarily establish the cause. The third scenario is elevated volatility without a sustained directional movement. Gold may experience repeated reversals as investors process monetary-policy expectations, geopolitical information and portfolio adjustments. Such conditions can be particularly demanding for strategies that require stable directional confirmation. These scenarios are conditional research frameworks, not forecasts with established probabilities. The next market movement must be evaluated using new observations as they become available.
What Professional Traders Should Distinguish
The most important distinction is between the reason a market may be moving and the justification for an individual trading decision. A trader may correctly understand that margin-related selling is contributing to pressure on gold and still lack an acceptable entry. Another may identify rising real yields as a relevant factor but underestimate execution costs or volatility. A third may observe a sharp decline and incorrectly assume that the market must rebound because gold is traditionally considered defensive. Understanding a plausible market mechanism does not automatically create a profitable strategy. The trader must still evaluate entry conditions, exposure, liquidity and the possibility that the interpretation is incomplete. Within NSI research, the quality of that decision process remains separate from the direction of the market.
Conclusion: Financial Stress Changes What Investors Must Do
Gold's decline during the October 2026 market turbulence illustrates a central principle of financial markets: an asset can be desirable over the long term while being sold aggressively in the short term. The need for liquidity can override investment preference. Margin requirements can force position reductions. Higher expected real yields can change the opportunity cost of holding gold. A stronger dollar, changing inflation expectations and broader portfolio losses can reinforce selling pressure. These mechanisms help explain why gold does not appreciate automatically whenever global uncertainty increases. For NSI Market, the episode also demonstrates why observable market conditions must be separated from psychological interpretations. A falling price can reveal financial pressure.
It cannot independently reveal the emotional condition of every investor. A margin call is a financial constraint, not necessarily evidence of panic. A rapid rebound is a price movement, not proof of collective relief or revenge trading. The scientific objective is to identify measurable conditions, investigate plausible mechanisms and remain explicit about what the evidence cannot establish. Gold can fall during a crisis not because investors no longer value protection, but because immediate financial obligations can become more powerful than the preference to hold it. Understanding that distinction is essential to interpreting liquidity stress, cross-asset pressure and the behavior of gold during unstable market conditions.
Gabriel Nicolaev – CyGuru
Frequently Asked Questions
Why can gold fall during a financial crisis?
Gold can decline during periods of financial stress when investors need immediate liquidity, reduce leveraged positions or sell liquid assets to meet financial obligations. Although gold is frequently considered a defensive asset, its short-term performance depends on monetary conditions, real yields, currency movements, positioning and market liquidity.
What is a liquidity-driven gold selloff?
A liquidity-driven selloff occurs when selling pressure is influenced by the need to obtain cash or reduce financial exposure rather than exclusively by a change in gold's perceived long-term value. Such selling may arise from portfolio deleveraging, margin requirements or broader funding pressures. Identifying liquidity as the actual cause of a particular price movement requires supporting evidence.
How do margin calls affect XAU/USD?
A margin call occurs when an account no longer satisfies the collateral requirements associated with its leveraged positions. The investor may need to provide additional collateral or reduce exposure. If participants sell gold-related instruments to meet these obligations, selling pressure can increase. However, a decline in XAU/USD alone does not prove that margin calls occurred.
Why can gold and stocks decline at the same time?
During periods of acute financial stress, investors may reduce exposure across multiple asset classes. The need for liquidity, changes in risk limits and portfolio deleveraging can contribute to simultaneous selling. Gold and equities do not maintain a fixed relationship, and their correlations can change across market regimes.
What is the relationship between real yields and gold prices?
Real yields represent interest rates adjusted for expected inflation, with the precise calculation depending on the instrument and method used. Higher real yields can increase the opportunity cost of holding non-yielding gold. However, the relationship is not deterministic, because gold is influenced by additional monetary, financial and geopolitical factors.
Does a stronger U.S. dollar always cause gold to fall?
No. Gold is commonly quoted in U.S. dollars, and changes in the dollar can influence international demand and valuation. However, gold and the dollar can sometimes rise or fall together. Their relationship depends on the wider economic environment.
Can a sudden decline in gold indicate panic selling?
A sharp decline accompanied by unusual volatility, heavy selling and deteriorating liquidity may be consistent with stressed market conditions. It does not independently establish that investors are experiencing panic. Psychological interpretations require evidence beyond price movement.
Can NSI Market detect global revenge trading?
No. Market-wide price and volatility data cannot establish that individual participants are attempting to recover previous losses through emotionally motivated transactions. The proposed NSI Market framework can investigate observable market conditions, but identifying revenge trading would require suitable individual behavioral evidence.
Can NSI predict the next XAU/USD movement?
NSI Market is a proposed analytical framework, not an independently validated directional forecasting model. Studying liquidity, volatility and market structure does not guarantee an ability to predict gold prices.
What should traders monitor after a major gold selloff?
Relevant observations include changes in volatility, liquidity, spreads, U.S. dollar movements, real yields, upcoming economic announcements and the market's response to previously important price levels. The significance of these observations depends on the trading strategy and the information available at the time.
Conclusion: When the Need for Liquidity Overrides the Search for Safety
Gold's reputation as a defensive asset does not mean that its price must rise during every episode of financial instability. In periods of acute market stress, investors may prioritize access to cash, collateral management and the reduction of financial exposure. These requirements can produce selling pressure even in assets that investors continue to regard as valuable over longer horizons. The distinction between long-term investment characteristics and short-term market behavior is essential. A financial asset may retain its perceived strategic importance while experiencing substantial temporary declines. Its price reflects the transactions taking place at a particular moment, not merely the reasons investors may wish to own it over time. The relationship among liquidity, margin requirements, real yields and currency movements is therefore central to understanding gold during periods of financial stress.
Yet explanations must remain proportional to the evidence. A declining price does not prove that forced liquidations occurred. Elevated volatility does not independently establish investor panic. A stronger dollar may contribute to pressure without being the only relevant variable. Within the proposed NSI Market framework, these distinctions provide the foundation for investigating market conditions without assigning unsupported psychological states to participants. The October 2026 XAU/USD decline illustrates why market behavior should be examined through several interacting layers: price structure, macroeconomic expectations, liquidity, financial exposure and the availability of new information. These layers may change rapidly, and their relationships may differ across market regimes. A scientifically responsible approach does not attempt to explain every decline through one convenient narrative. It evaluates the available evidence, identifies competing explanations and acknowledges uncertainty where the relevant information is incomplete.
I believe this is particularly important when financial pressure creates a temptation to transform complex market events into simple stories about fear or greed. The market is not one individual with one emotional state. It is a network of participants operating under different objectives, constraints and information. Some may be seeking protection. Others may be reducing leverage. Some may be executing systematic strategies, while others may be responding to immediate funding requirements. The same price movement can result from the interaction of these very different decisions. Gold can remain an important defensive asset while declining during a liquidity shock. Understanding that apparent contradiction requires studying the structure of financial markets, not assuming that every price movement reveals the collective emotions of investors. That distinction is fundamental to NSI Market Intelligence.
Gabriel Nicolaev – CyGuru
Selected Scientific and Institutional Bibliography
-
Baur, D. G., & Lucey, B. M. (2010). Is gold a hedge or a safe haven? An analysis of stocks, bonds and gold. Financial Review, 45(2), 217–229. https://doi.org/10.1111/j.1540-6288.2010.00244.x
-
Baur, D. G., & McDermott, T. K. (2010). Is gold a safe haven? International evidence. Journal of Banking & Finance, 34(8), 1886–1898. https://doi.org/10.1016/j.jbankfin.2009.12.008
-
Brunnermeier, M. K., & Pedersen, L. H. (2009). Market liquidity and funding liquidity. Review of Financial Studies, 22(6), 2201–2238. https://doi.org/10.1093/rfs/hhn098
-
Adrian, T., & Shin, H. S. (2010). Liquidity and leverage. Journal of Financial Intermediation, 19(3), 418–437. https://doi.org/10.1016/j.jfi.2008.12.002
-
Gârleanu, N., & Pedersen, L. H. (2011). Margin-based asset pricing and deviations from the law of one price. Review of Financial Studies, 24(6), 1980–2022. https://doi.org/10.1093/rfs/hhr027
-
Vayanos, D. (2004). Flight to quality, flight to liquidity, and the pricing of risk. NBER Working Paper No. 10327. https://doi.org/10.3386/w10327
-
World Gold Council. Gold as a strategic asset. https://www.gold.org/goldhub/research
-
CME Group. Understanding margin and futures risk management. https://www.cmegroup.com/education.html
-
Federal Reserve Bank of St. Louis. FRED Economic Data: Treasury Inflation-Indexed Securities. https://fred.stlouisfed.org/
These references provide theoretical and institutional context for liquidity, safe-haven behavior and leveraged markets. They do not independently establish the cause of the October 23, 2026 gold-price movement.
About the Author
Gabriel Nicolaev – CyGuru is an author and entrepreneur whose work explores gold trading, behavioral finance, neuroscience-oriented research, artificial intelligence and human decision-making.
He is the author of The Gold Nervous System Indicator, a 36-chapter interdisciplinary work presenting the proposed NSI framework and examining the relationship between the nervous system, financial uncertainty and trading decisions.
Through NSI.GOLD, he develops educational and research-oriented publications concerning market conditions, trader psychology and the scientific limitations of behavioral interpretation.
 Market
 Market
 Market